Shading you can see.
Shading is the largest variable in most rooftop yield estimates, and the least examined. Usually it’s a single percentage, borrowed from a rule of thumb or a 2D satellite estimate. On a city-centre roof surrounded by stair cores, plant and taller neighbours, that figure can be badly wrong.
Raycast, per module, per hour
Zervio Eco models the site in photorealistic 3D, then traces a ray from every module to the sun for every daylight hour of a representative year. If the ray reaches the sun, that module is lit at that hour. If it doesn’t, Eco records what blocked it.
Near-field obstructions are tested against the 3D model. The far horizon (hills, towers, terrain) is traced out to 8 km. A diffuse sky-view factor covers the light that doesn’t come straight from the sun.
See the beam
Select any segment or panel and Eco draws its sun rays in the scene: green when the beam reaches the sun, red when it ends at the obstruction. Pick a date and time and you can see exactly which chimney, parapet or neighbouring block is costing generation, and in which months.
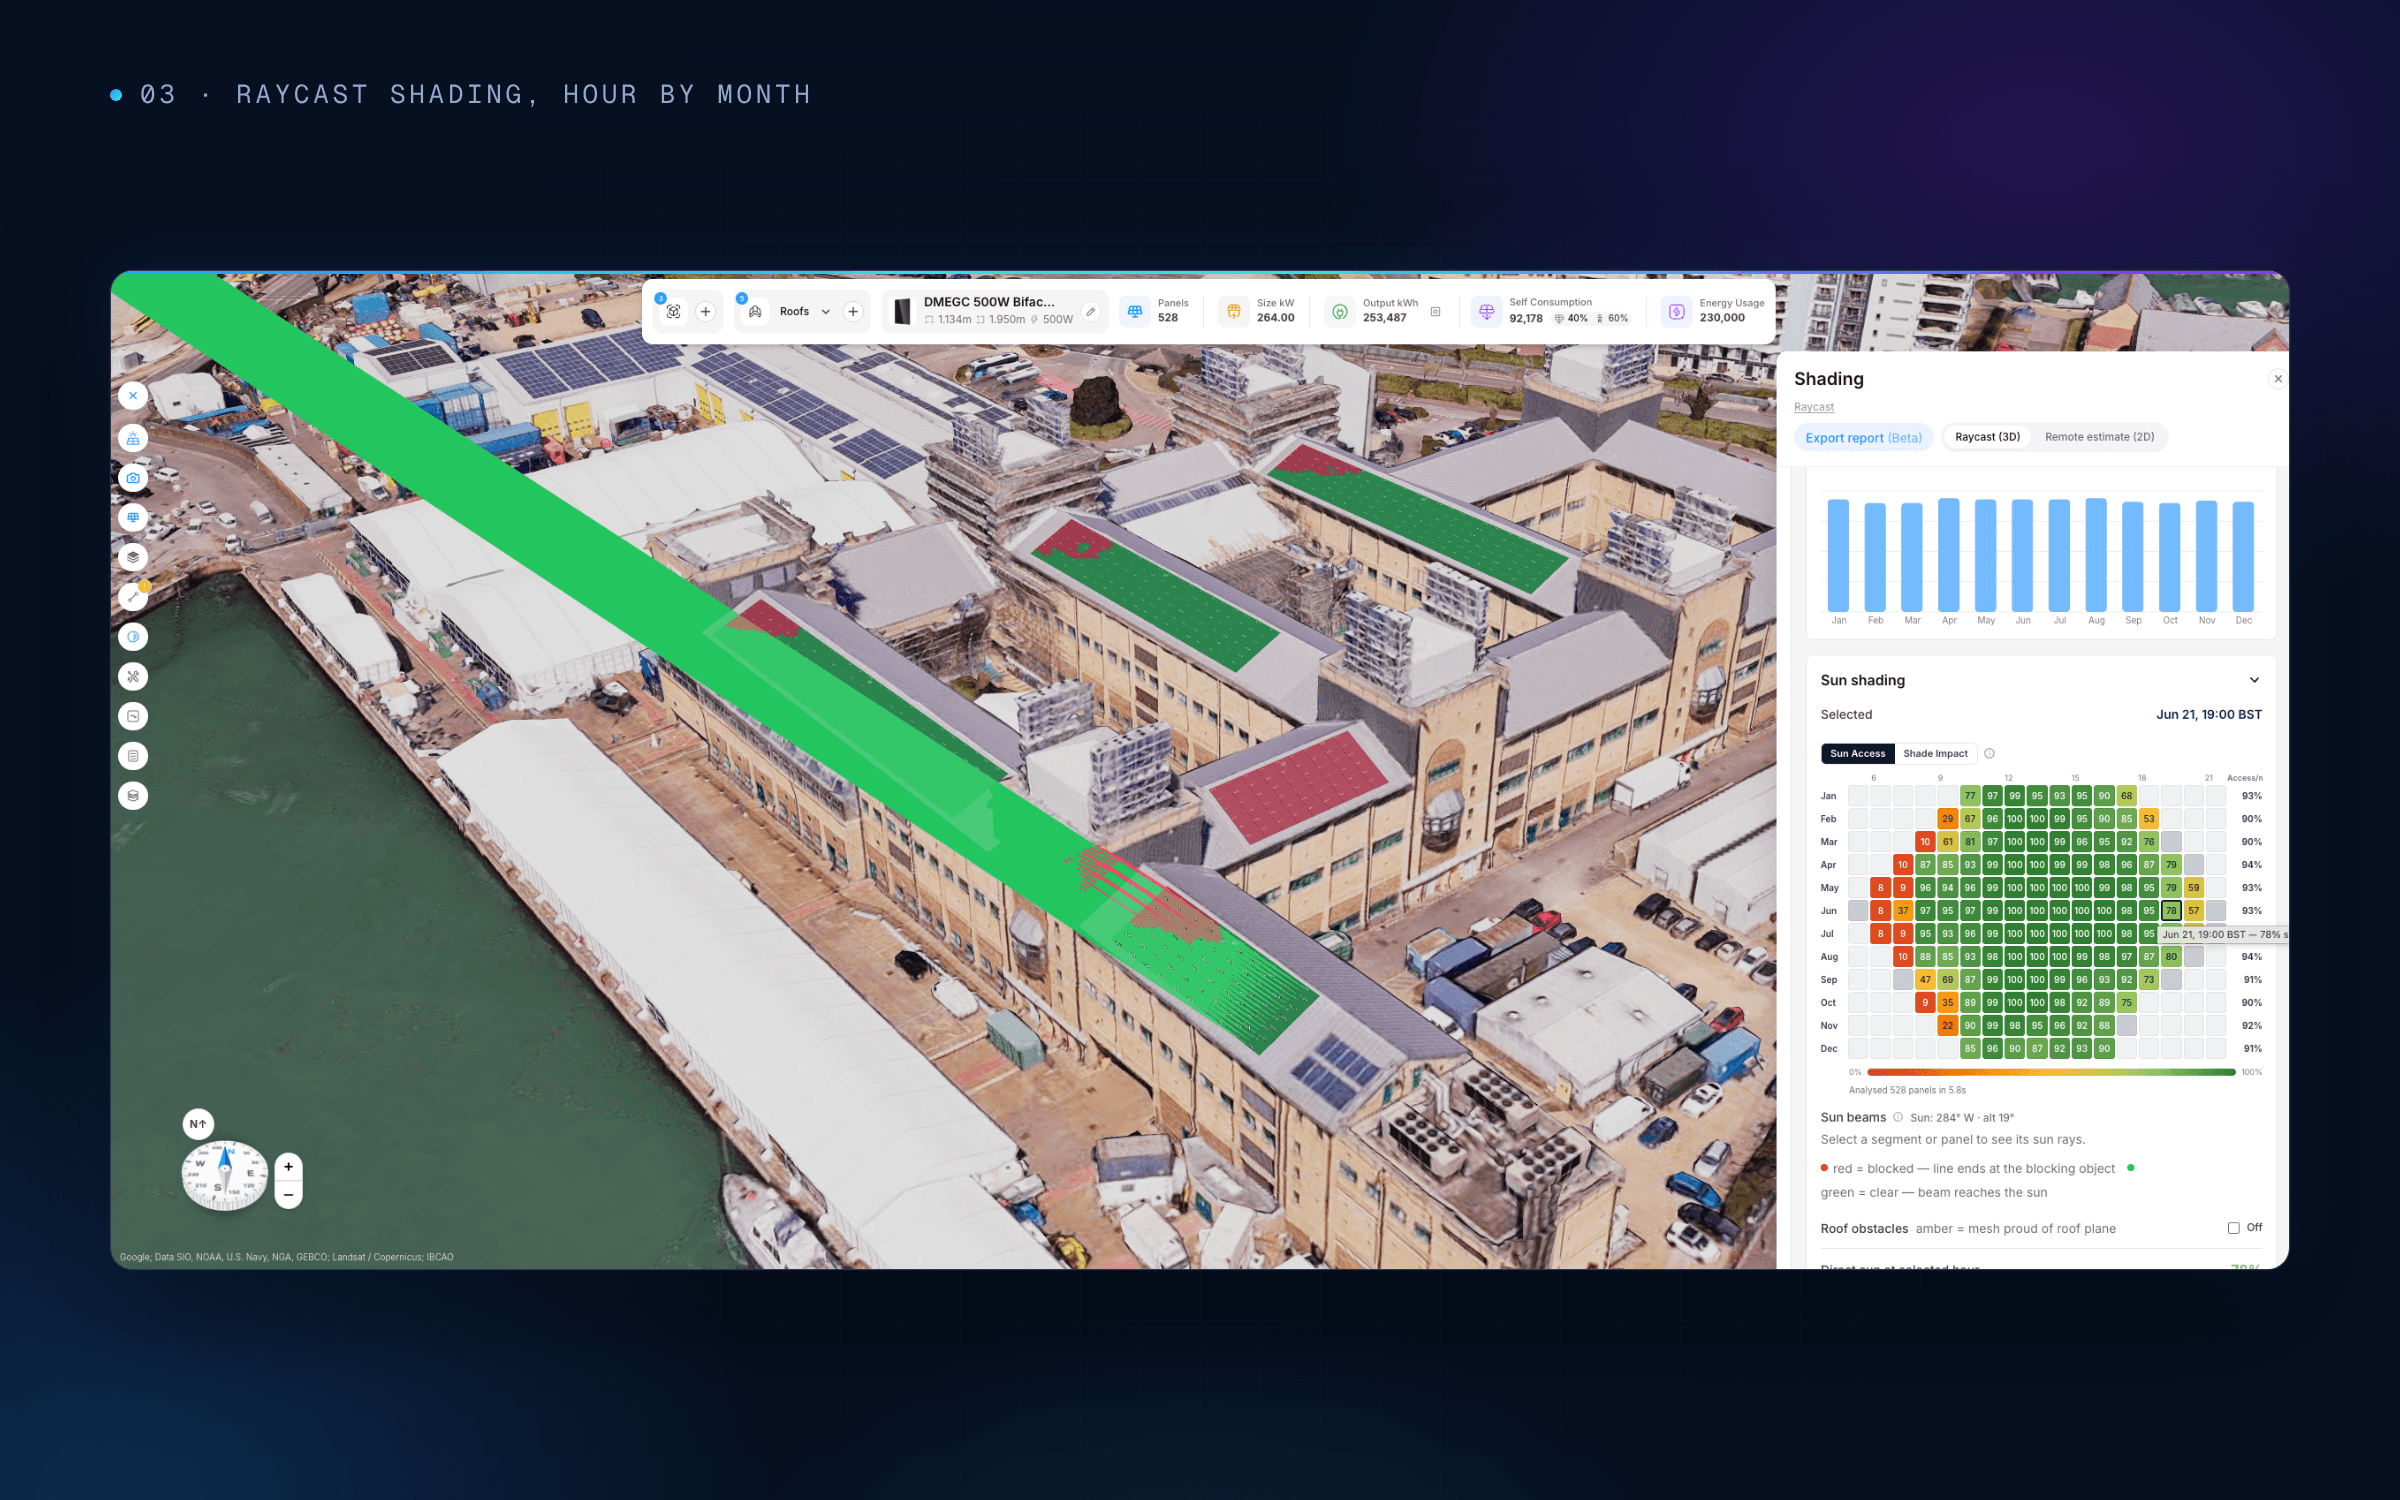
21 June, 19:00. The beam shows exactly where the evening sun is lost.
The whole year, in one view
The sun-path chart plots every month’s arc against the measured skyline, so the blocked hours are visible at a glance. Each segment also gets a full hour-by-month sun-access matrix with monthly access percentages.
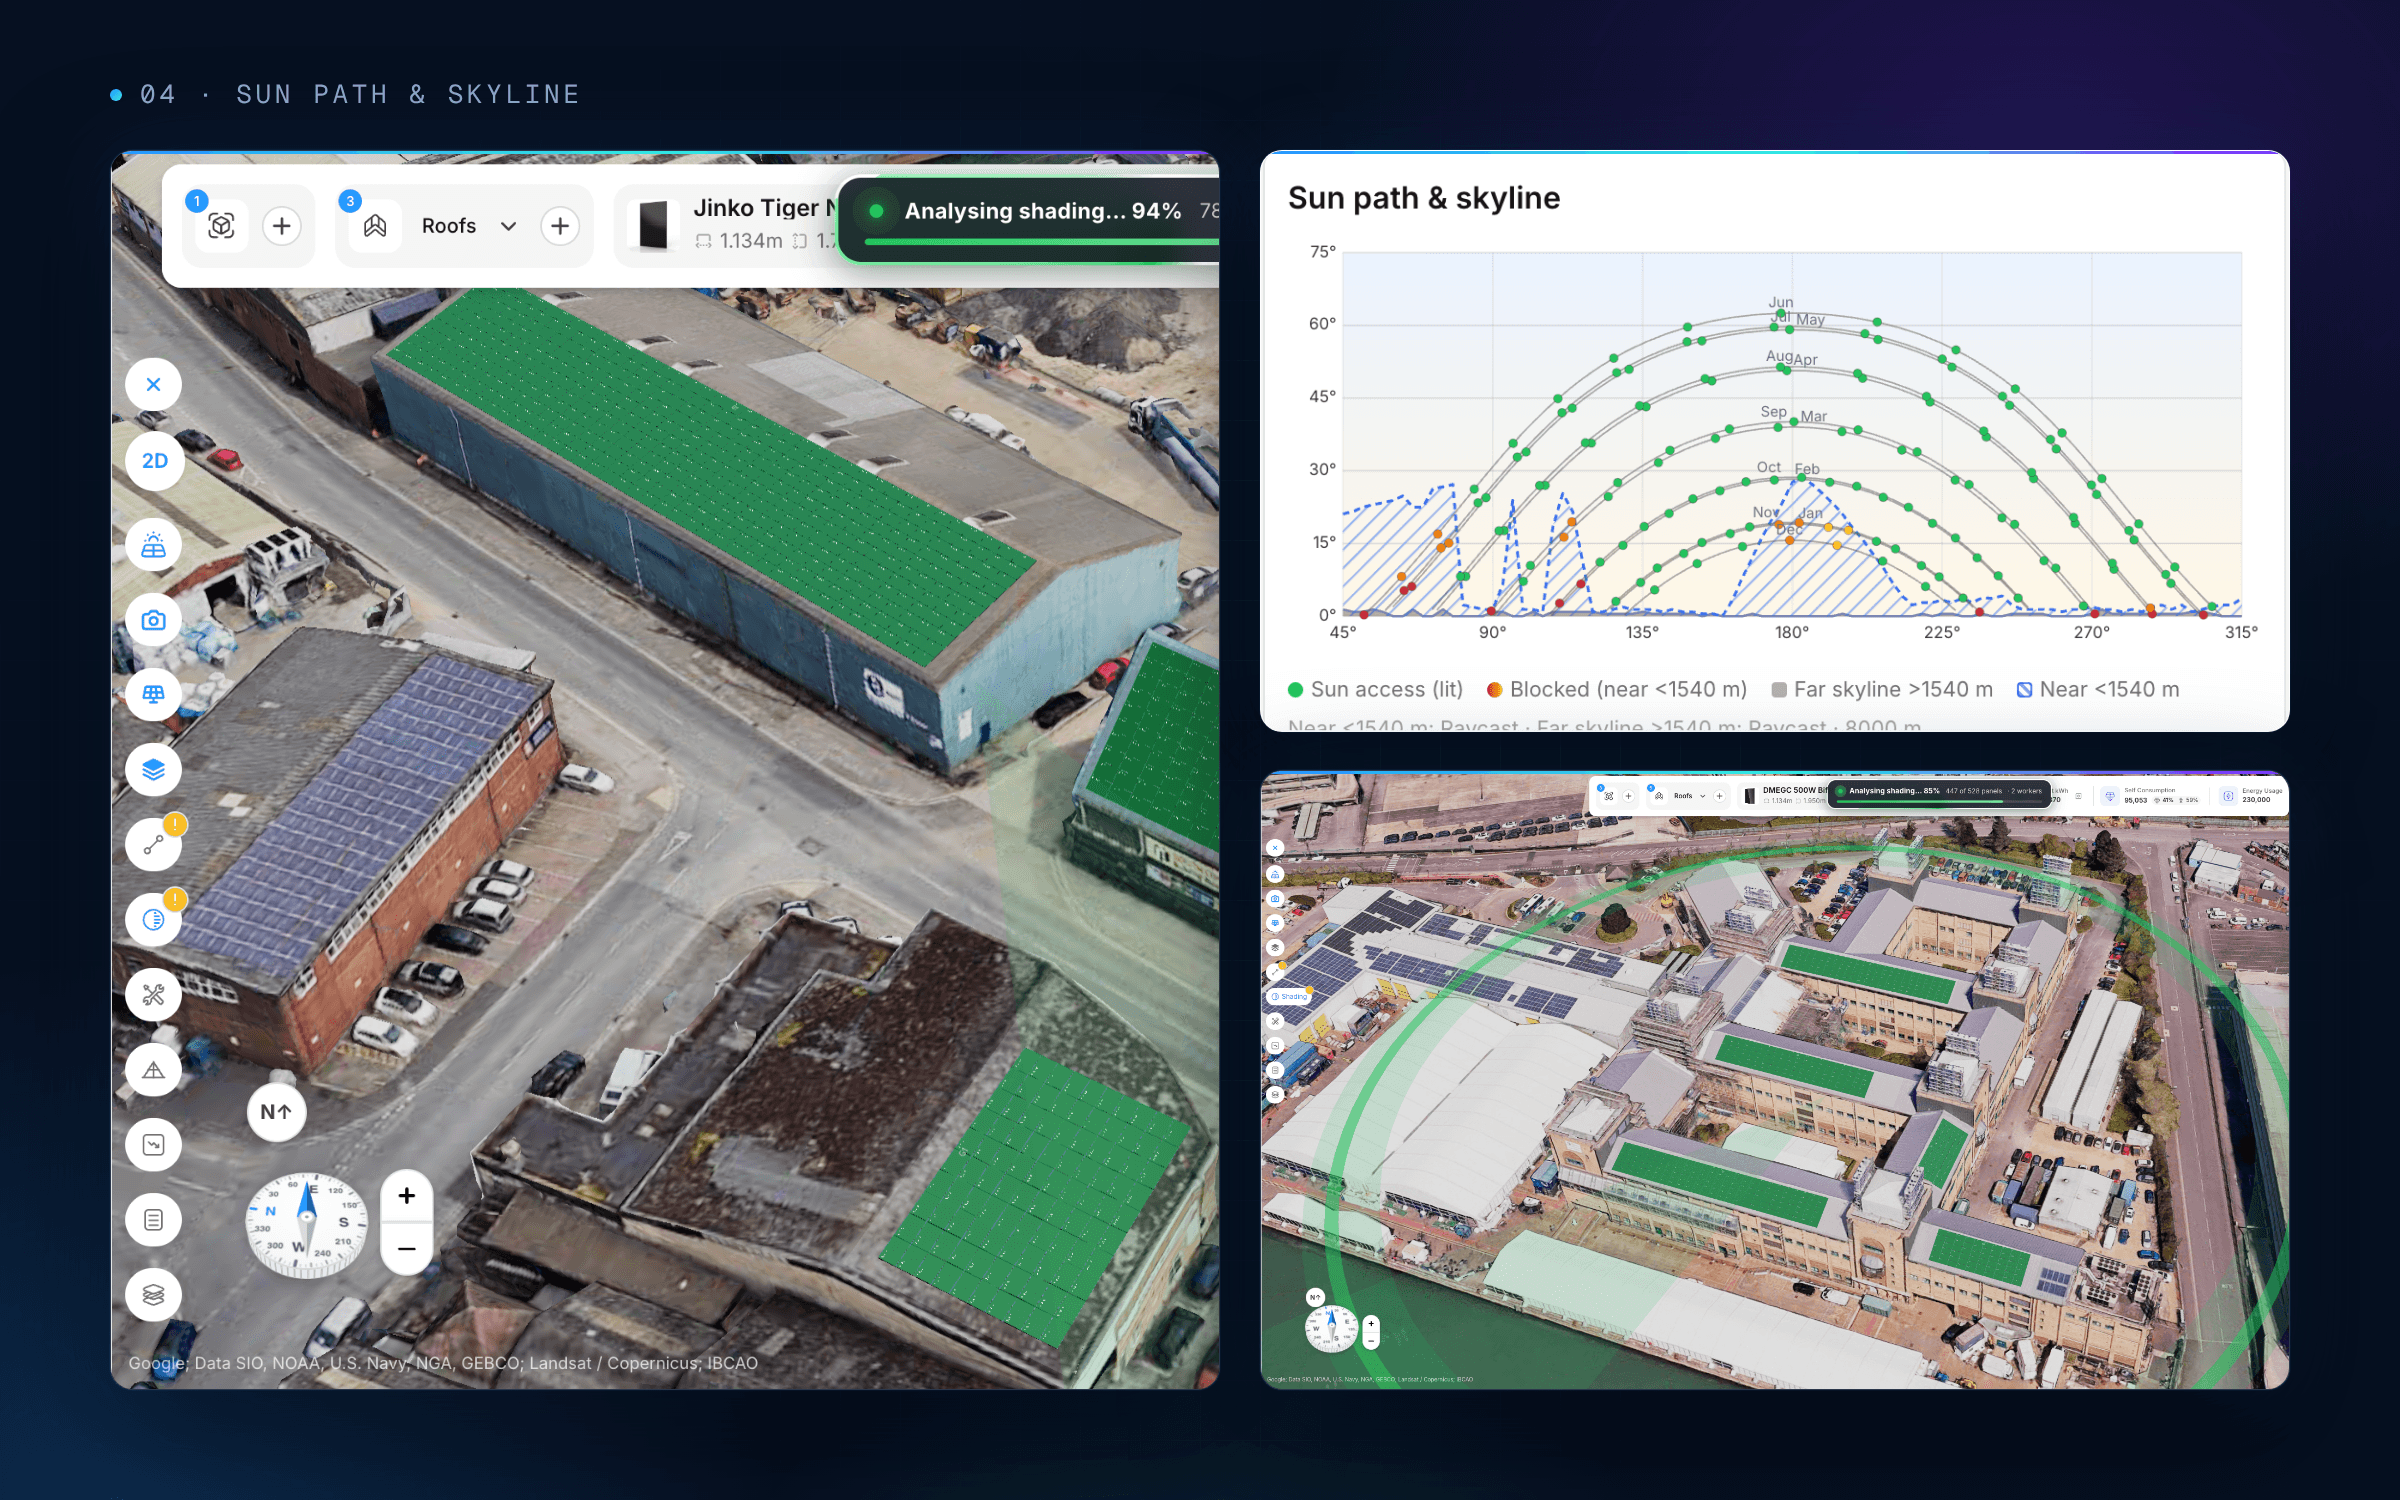
Sun path against the measured skyline.
Fast enough to design with
Analysis runs in parallel in the browser. A 528-module, five-roof scheme is analysed in under six seconds, so shading becomes a design tool rather than a step at the end. Move a group off a shaded corner, re-run, and see the result straight away.
From shading to yield
Raycast results flow directly into P50 and P90 yield and into the stringing design. Modules that share a shading pattern can be strung together, and the loss figure in the proposal is one an engineer can verify.
If you can’t point to what’s casting the shadow, you can’t defend the number.
Read next: Engineered, not estimated · Bankable by design

Author
Shalz Parashara
Share Article